
Figure 1.2: Danhaive et al.


Abstract
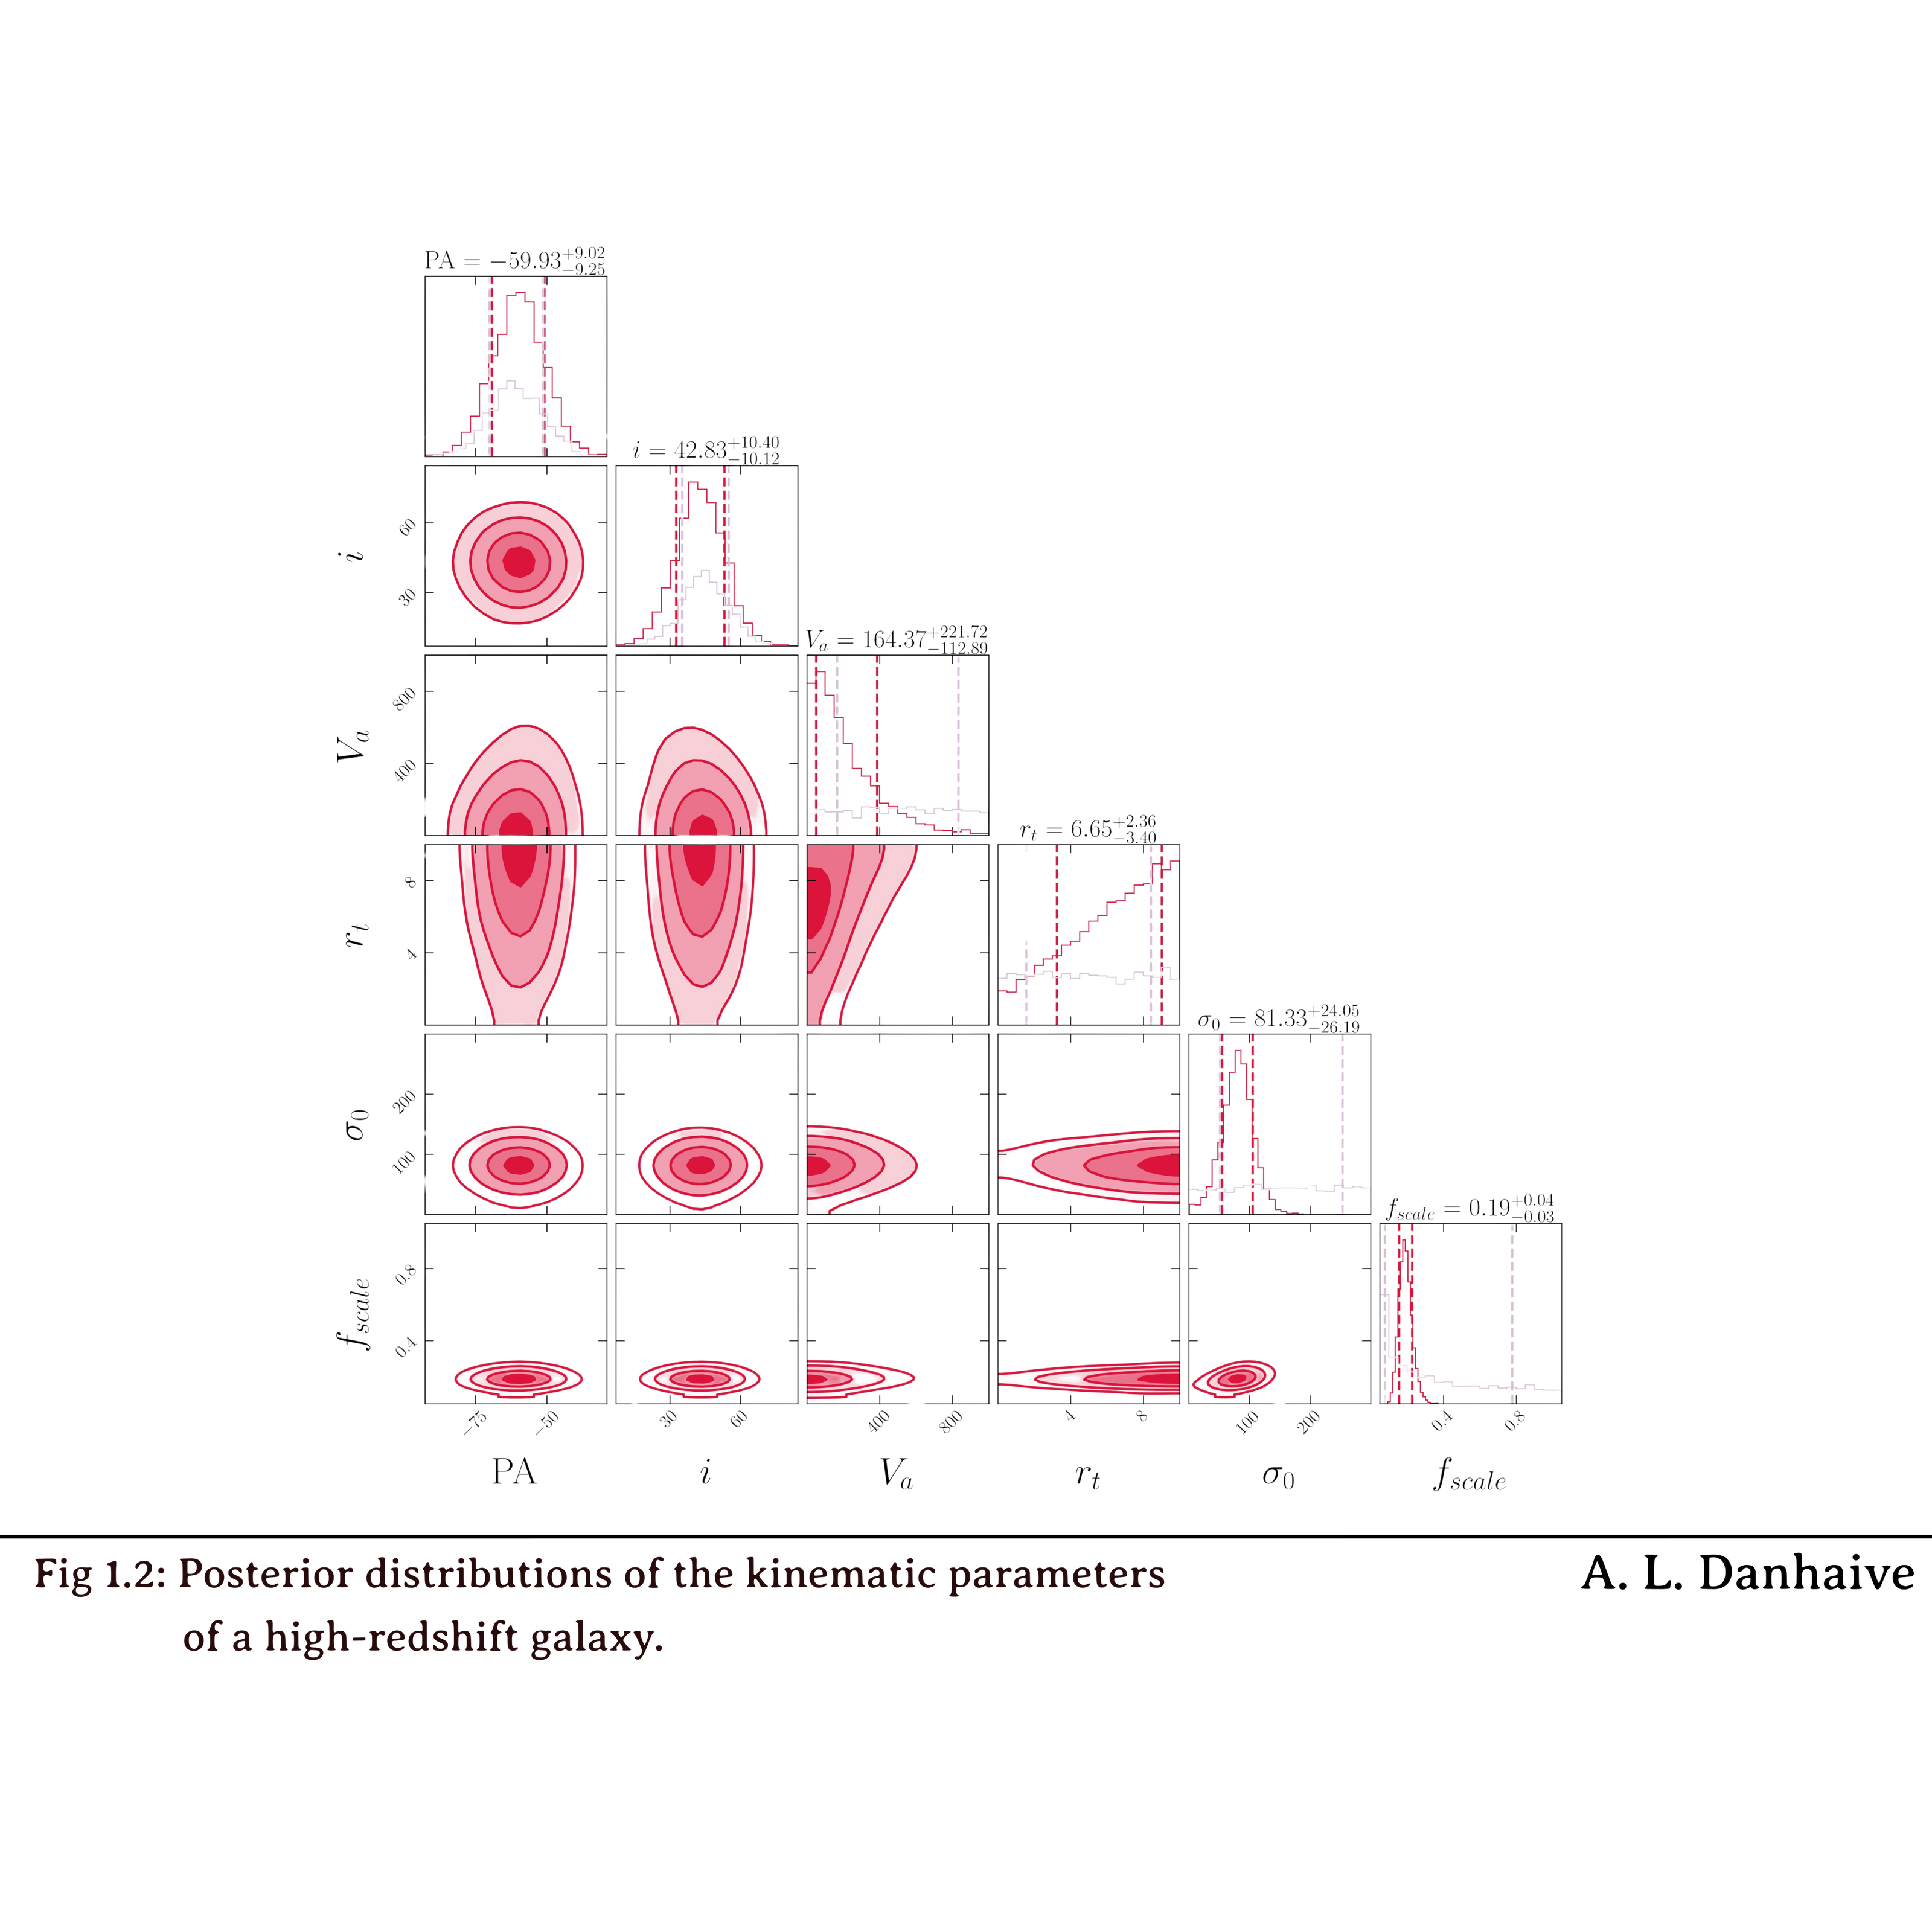
When looking at distant galaxies with the James Webb Space Telescope, we are able to see them as they were a very long time ago. This is due to the finite speed of light, meaning light from very distant galaxies can take billions of years to reach us. When it does, we see a snapshot of the galaxy as it was when the light first left it billions of years ago. This allows us to study the physical properties of galaxies across the history of the universe. In this figure, you see the result of an analysis aimed at understanding how the gas and stars in a distant galaxy are moving—a study referred to as galaxy kinematics.
To understand how the galaxy is rotating, we assume that the rotation follows a specific equation—or model—with a given number of unknown parameters. Using statistics, we can determine which values of these parameters produce a model that best fits the data. For a simple example, this is like fitting a line to a set of points and determining the slope and y-intercept of the line. This figure shows which values provide the best fit for this galaxy when assuming a rotating disk model. Each distribution indicates the region where we expect the parameter to be; the more points in a region, the more likely it contains the correct value for this galaxy. In other words, the peaks indicate the values with the highest likelihood, which are then written above for each parameter.